Foreword from the CEO and the Chairman
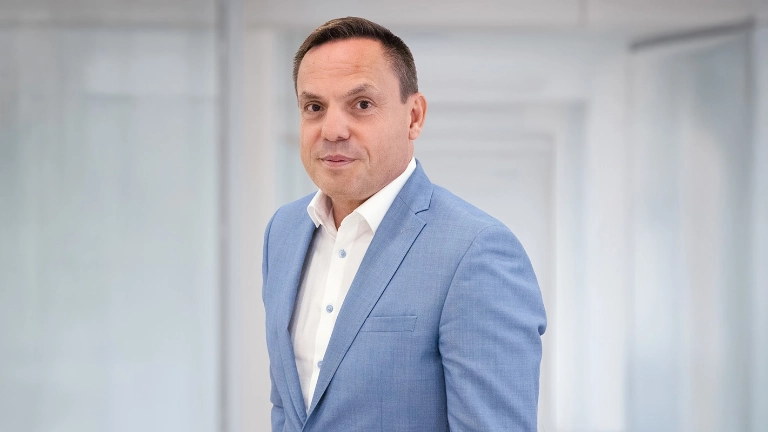
Stijn Bijnens, CEO
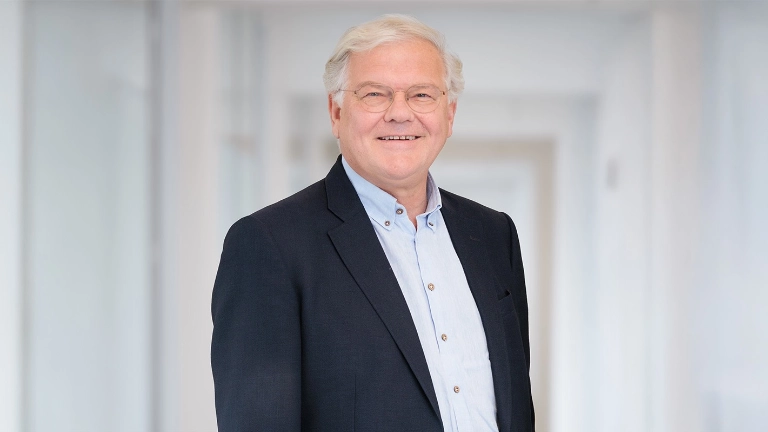
Stefaan De Clerck, Chairman
In the spotlight
Fiber network covering around 42% of Belgian premises, and 5G indoor coverage reaching 89.5%

1.2 million mobile phones collected and fixed devices refurbished

90% of Proximus SA employees attended at least five days of training, supported by an investment of EUR 45.9 million in employee re- and up-skilling

Launch of Smarter Online, an interactive tool designed to help people assess suspicious online situations
Discover the annual report
Explore the 2025 Annual Report by section. Use the links below to navigate directly to the main chapters of the report.
Proximus Group at a glance

Sustainability statement